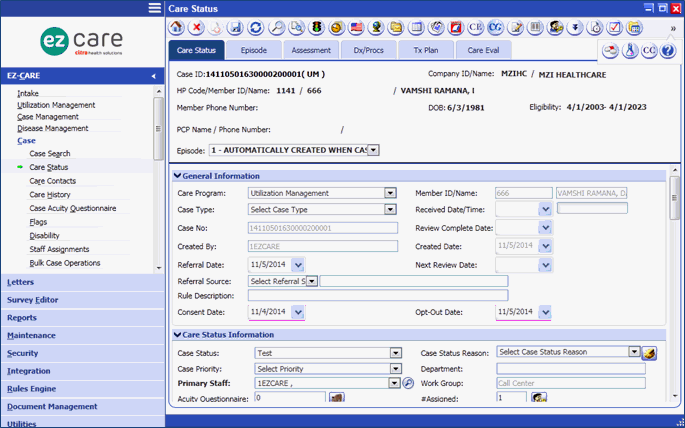
The Care Status tracks the overall case information including General Information, Care Status Information, Custom Information, Overall Condition, Provider, Hospitalization and Patient Details.
While creating a Case, we can add the ‘Consent date and Opt-Out date’ in Care Status screen General Information Tab when case is created.
Example: Care Status screen
Additional Fields are Added in Case Header in Care Status:
As shown below
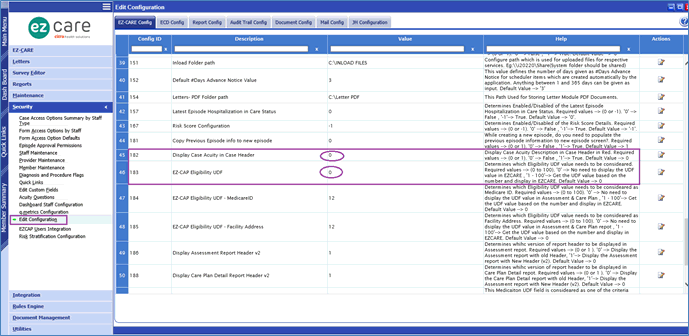
1. Facility Name (Based on Configuration ID 183)
2. Case Acuity (Based on Configuration ID 182)
For Example:
Entered Data for UDF012 as Facility Name = ”This is test” for Member in EZ-CAP Screen as shown in the below screen shot.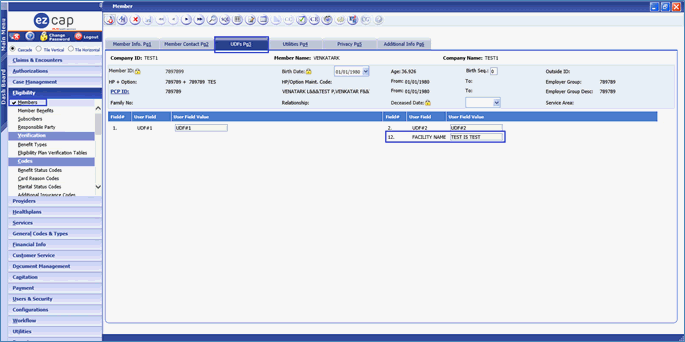
How to Configured for Configure ID 182,183 in Edit Configuration for EZ-CARE:
For Config ID 182,183 for Value=1,12 given and data is displayed
Based on case acuity configured for Member it is displayed in Case header.
As shown in the below screen shot.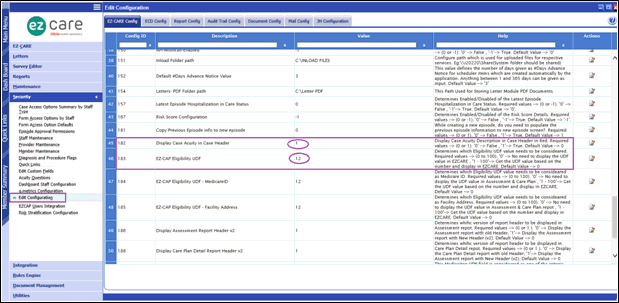
For Edit value in EZ-CARE Config Tab in Edit Configuration screen.
Click on Edit button icon under action column and Change the Value for Config ID “182”,”183”.
Enter value is “1”,”12” and click on update button in Edit Configuration.
Click on 'ok' on Pop-up Message “Updated Successfully” should be displayed.
Logout EZ-CARE and Login EZ-CARE application again.
New fields are added in Case Header for “Facility Name”, “Case Acuity” in Case Header in Care Status screen. In Overall condition in Care status for “case acuity” field data is selected from drop down list and click on “save” button from tool bar in Care status screen. Case acuity data will be reflects in Case Header for Case Acuity Field.
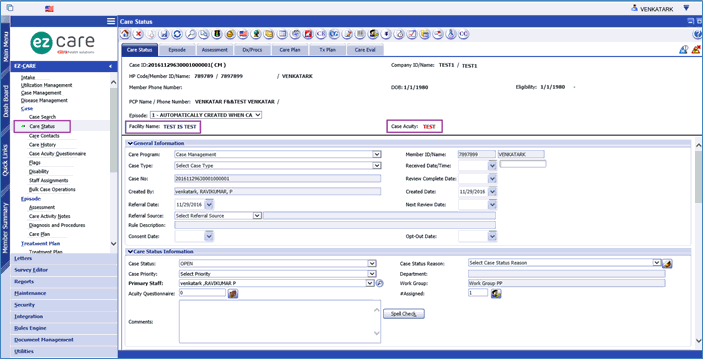
Example: Care Status Screen for Facility Name, Case acuity in Case Header screen
For Config ID 182,183 for Configuration Value=0, 0 given and data is not displayed in Case Header in Care Status screen. As shown in the below screen shot.
For Edit value in EZ-CARE Config Tab in Edit Configuration screen.
Click on Edit button icon under action column and Change the Value for Config ID “182”,”183”.
Enter value is “0”,”0” and click on update button in Edit Configuration.
Click on 'Ok' on Pop-up Message “Updated Successfully” should be displayed.
Logout EZ-CARE and Login EZ-CARE application again.
New fields are not added in Case Header for “Facility Name”, “Case Acuity” in Case Header
in Care Status screen. As shown in the below screen shot.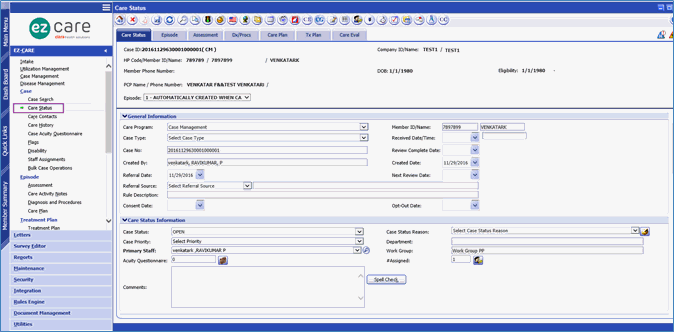
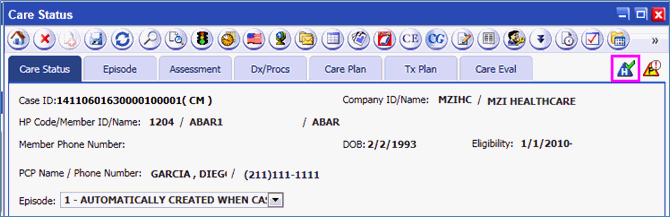
q.metrics and JH Alert:
q.metrics Alert:
Alert icons are provided based on Johns Hopkins risk profiles and HEDIS care gaps for a member / provider in Care Status Header part.
Types of Alerts:
 -->This
icon is displayed in any one of the below criteria:
-->This
icon is displayed in any one of the below criteria:
If the q.metrics web service is not configured in EZ-CARE q.metrics configure Tab for all the Items.
Invalid q.metrics Configuration in EZ-CARE.
Any Error returned from q.metrics web service.
 -->This
icon is displayed based on the below criteria:
-->This
icon is displayed based on the below criteria:
If there is no Care Gap for a member / provider then this q.metrics icon should displayed.
On Click of this icon-->open a popup having no care gap message.
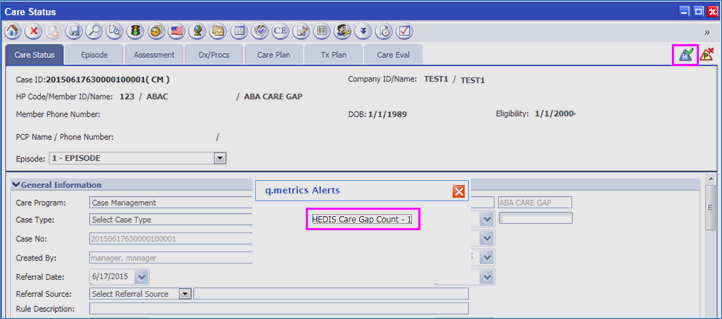
 -->If
the q.metrics
web service returns the Care Gap count is greater than 0 then this q.metrics
icon is displayed. This means if a Member / Provider is having care gap
then this icon is displayed.
-->If
the q.metrics
web service returns the Care Gap count is greater than 0 then this q.metrics
icon is displayed. This means if a Member / Provider is having care gap
then this icon is displayed.
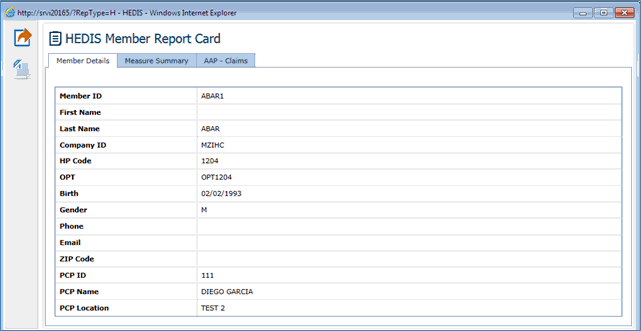
On click a pop up with the Care gap count is displayed as shown below:
On Click of the Care gap count in above popup, the below HEDIS report will be displayed.
JH Alert:
JH Alert is displayed based on the Member’s Risk. These alerts are based on Predictive Modeling, available in EZ-CARE.
Note: JH should be installed to view the predictive modelling reports and the JH alerts.
Types of Alerts:
 -->This
icon is displayed in any one of the below criteria:
-->This
icon is displayed in any one of the below criteria:
If the configuration item ‘Period’ is not configured.
If the configuration item 'Probability Hospital Admissions (12 mos)' and ‘Probability High Total Cost’ is not configured and '0.0' will be considered as default for both the items.
On click on alert icon, a popup window display with warning messages ‘Period was not configured’.
 -->This icon is displayed in any one of
the below criteria:
-->This icon is displayed in any one of
the below criteria:
If the member does not fall under the configured 'Probability Hospital Admissions (12 mos)' or ‘Probability High Total Cost’ and 'Period'.
On click on alert icon, a popup window displays with warning message ‘Risk profile is not available for this Member’.
 -->This icon is displayed in any one of
the below criteria:
-->This icon is displayed in any one of
the below criteria:
If the member fall under the configured 'Probability Hospital Admissions (12 mos)' or ‘Probability High Total Cost’ and 'Period'.
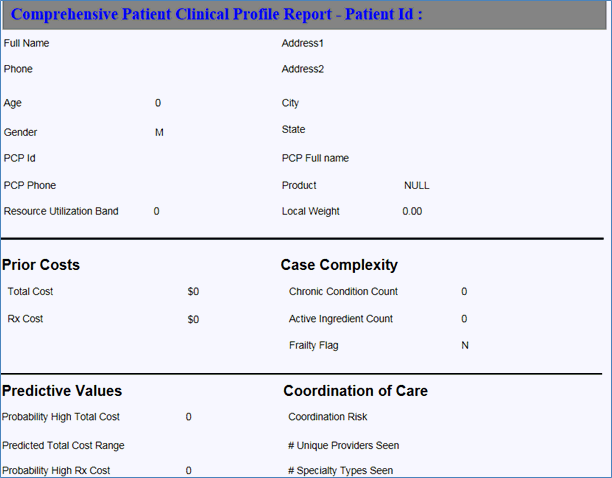
On click on Alert icon, predictive modeling report is displayed.
Note: To view the JH Alerts, user need to enter values in JH Configuration tab in Edit Configuration in Security module.
On Click, report is displayed as shown below:
These JH and q.metrics Alerts are also observed in Lab Diagnostics, Care Activity Notes, Member Medications, Member Profile, Member general Info, Member Summary, Provider Profile screens.
Information that will automatically default from the Create Case screen and the Member Profile includes:
Care Program
Group Name—read only field
PCP/ID
Primary DX
Primary Procedure
Case Status
Primary Staff
Workgroup—read only field
Created by—read only field
Care Status – cont’d.
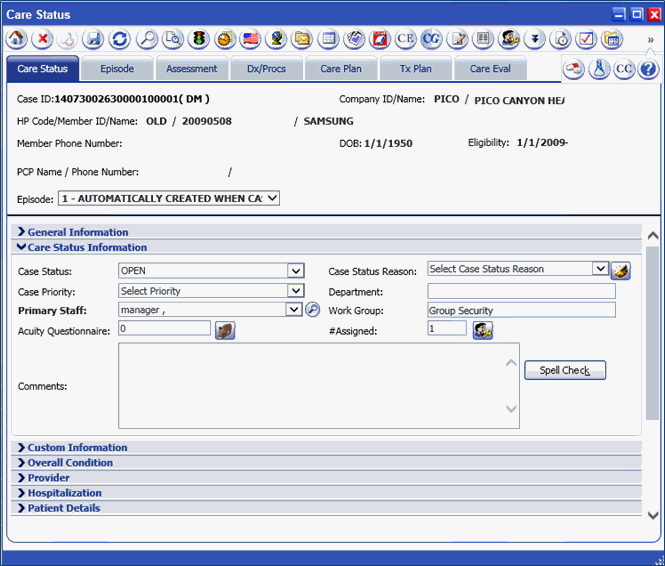
Example: Care Status- Care status Information screen
If the primary Staff is auto assigned through work group, then it is displayed in Black. If any other Staff is searched and populated, then it appears in Blue.

Example: Care Status – Custom Information Screen
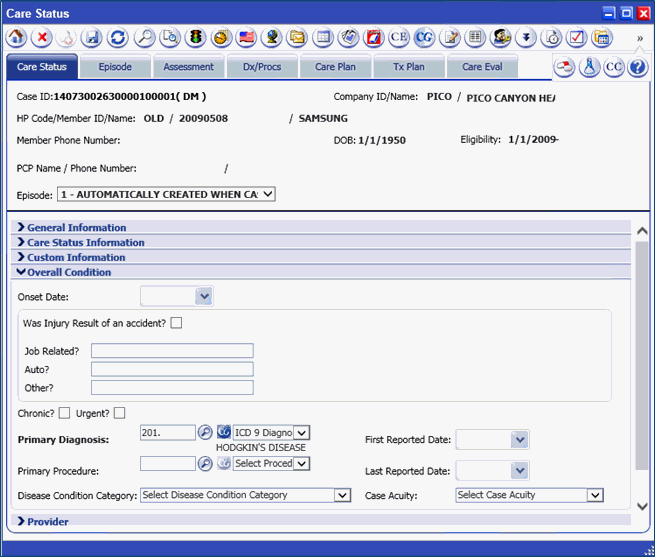
Example: Care Status – Overall Condition Screen
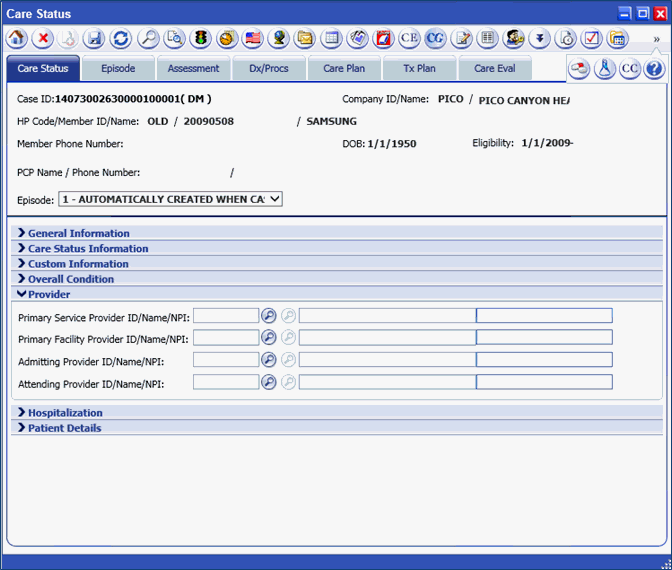
Example: Care Status – Provider Screen
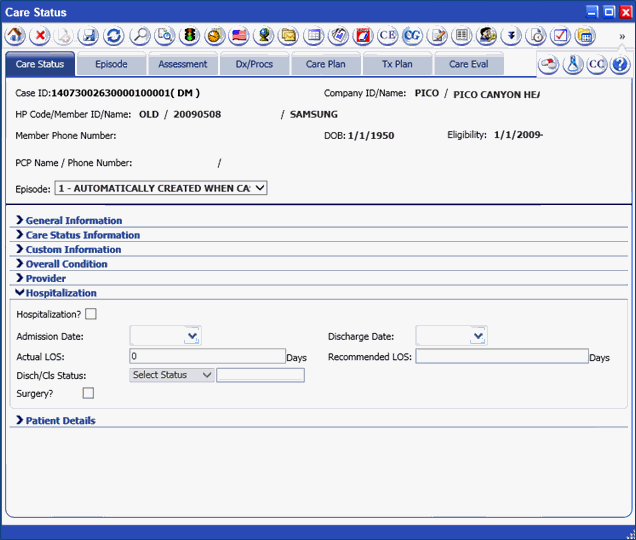
Example: Care Status – Hospitalization Screen
When Configuration “Latest Episode Hospitalization in Care Status” when “0(Zero)” (Configuration #157)
Updated Hospitalization details in Care Status will not be updated in First Episode hospitalization i.e. after Case is created any further modifications to Hospitalization details in Care Status will not be reflected in Episode.
When Configuration “Latest Episode Hospitalization in Care Status” when “-1” (Configuration #157)
Updated Hospitalization details in Care Status will be updated in latest Episode hospitalization.
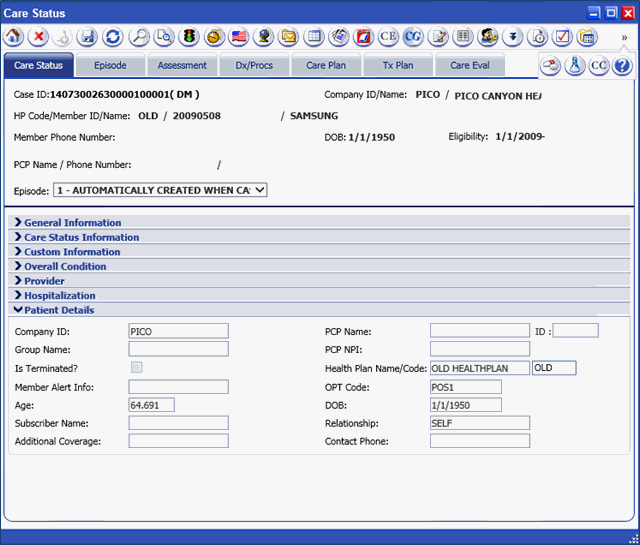
Example: Care Status – Patient Details Screen
1. Click
on the ‘View EZ-CAP Case’  button
from tool bar, to open the EZ-CARE Case in the EZ-CAP application without
using ‘Sync with EZ-CAP’
button
from tool bar, to open the EZ-CARE Case in the EZ-CAP application without
using ‘Sync with EZ-CAP’
 button.
2. Click
on the‘Sync with EZ-CAP’ button
from tool bar, to sync the migrated Cases from EZ-CAP 5.x to 6.x.
button
from tool bar, to sync the migrated Cases from EZ-CAP 5.x to 6.x.
3. Click
on the ‘InterQual’ button
from tool bar to connect the Care Enhance Review Manager Enterprise.
button
from tool bar to connect the Care Enhance Review Manager Enterprise.
4. Click
on ‘Case Documents’  button from tool bar to upload
the Case Related documents.
button from tool bar to upload
the Case Related documents.
5. Click
on the ‘Status History’  button to view a record
of all Case Status changes, and reasons for changes, with associated automatic
date stamp.
button to view a record
of all Case Status changes, and reasons for changes, with associated automatic
date stamp.
6. Click
on the ‘Assign Staff’ button to add additional
staff members to the case.
button to add additional
staff members to the case.
7. Click
on the ‘Milliman’ button
to open the URL given in the Edit Configuration in Security module.
button
to open the URL given in the Edit Configuration in Security module.
8. Click
on the ‘Case Acuity’  button on the lower left side
of the screen to complete the user defined Case Acuity Questionnaire (used
in automated case assignment).
button on the lower left side
of the screen to complete the user defined Case Acuity Questionnaire (used
in automated case assignment).
9.
When
clicked on ‘Home’  icon from the care status, if it is a Case
Management case it takes us to the ‘Case
Management’ case creation screen.
icon from the care status, if it is a Case
Management case it takes us to the ‘Case
Management’ case creation screen.
10. Click
on ‘Delete Record’  to permanently
remove a Case from the EZ-CARE database.
to permanently
remove a Case from the EZ-CARE database.
11. Click
on ‘Save Record’  to save the
changes made to a Case.
to save the
changes made to a Case.
12. Click
on “Case Search”  button to navigate to Case Search screen to search
and populate a Case.
button to navigate to Case Search screen to search
and populate a Case.
13.
When
clicked on “Preview Record”
 button,
Care Status report screen opens.
button,
Care Status report screen opens.
14.
Click
on ‘Activity’  button to
view a particular case related care activity details.
button to
view a particular case related care activity details.
15. Click
on ‘Staff Scheduler’  button
to view the staff scheduler summary window.
button
to view the staff scheduler summary window.
16. Click
on ‘Flags’  icon to view
the current flags for particular Case ID and Company ID in Flags Summary
window.
icon to view
the current flags for particular Case ID and Company ID in Flags Summary
window.
17. Click
on ‘History’  which displays
the current member cases and authorizations for a Company ID.
which displays
the current member cases and authorizations for a Company ID.
18. When clicked
on “Letters”  button, the
Case Letters screen is opened which helps in sending Case Letters.
button, the
Case Letters screen is opened which helps in sending Case Letters.
19. When clicked
on ‘List View’  button, the
Case List window is opened which displays all the case information for
cases present in Case Search-->Currently
Selected Cases Grid.
button, the
Case List window is opened which displays all the case information for
cases present in Case Search-->Currently
Selected Cases Grid.
20. Click
on ‘Case Documents’  button
from tool bar to upload the Case Related documents.
button
from tool bar to upload the Case Related documents.
21. When clicked
on ‘Notes’  button, the
Case notes window is displayed where users can the notes details for a
Case.
button, the
Case notes window is displayed where users can the notes details for a
Case.
22.
Click
on ‘Memos’  button, which
allows users to add memo details for a case.
button, which
allows users to add memo details for a case.
23.
Click
on ‘Staff Assignments’  button, which
displays the Staff assignment summary window where you can assign staff
to a case by clicking the Add
button.
button, which
displays the Staff assignment summary window where you can assign staff
to a case by clicking the Add
button.
24. Users
can view the recently used cases and populate them by clicking on ‘Session
History’  button.
25. When users
Click on ‘Staff Scheduler Details’
 button,
they can add staff scheduler details in the window which pops up.
button,
they can add staff scheduler details in the window which pops up.
26. When Users
click on ‘Audit Trail’  they
can view an audit trail of cases which is useful to track any changes
in Care Status screen.
they
can view an audit trail of cases which is useful to track any changes
in Care Status screen.
27. When Users
click on ‘Help’  Icon from
any screen of the EZ-CARE application a detailed help related to the Care
Status screen pops-up.
Icon from
any screen of the EZ-CARE application a detailed help related to the Care
Status screen pops-up.
28. When User
clicks on ‘Lab Diagnostics’
 Icon,
Lab Diagnostics from Member Summary opens.
Icon,
Lab Diagnostics from Member Summary opens.
29. When User
clicks on ‘Member Medications’
 Icon,
Member Medications from Member Summary opens.
Icon,
Member Medications from Member Summary opens.
30. When
User clicks on ‘Condition Codes’
 Icon, a pop up opens displaying the condition codes of the current case
Member. If the current date is greater than or equal to member’s condition
code from date, then the CC icon is highlighted. If the current date is
outside the member’s condition code active period, then the CC icon is
not highlighted. This icon is also displayed for Member Profile, Member
Documents, Lab Diagnostics, Member General Info, Member Summary screens.
Icon, a pop up opens displaying the condition codes of the current case
Member. If the current date is greater than or equal to member’s condition
code from date, then the CC icon is highlighted. If the current date is
outside the member’s condition code active period, then the CC icon is
not highlighted. This icon is also displayed for Member Profile, Member
Documents, Lab Diagnostics, Member General Info, Member Summary screens.
Note: The Care Status screen includes a feature to preview a case summary report including patient information, eligibility information, and case status history, levels of care and staff assignments. Click on the Preview button Icon from the Tool bar.
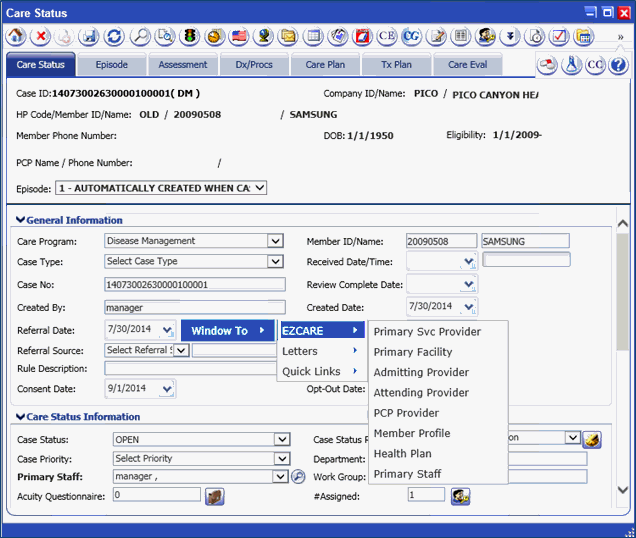
Windows To Option in Care Status:
Right click on Care status screen to access the “Window To” option.
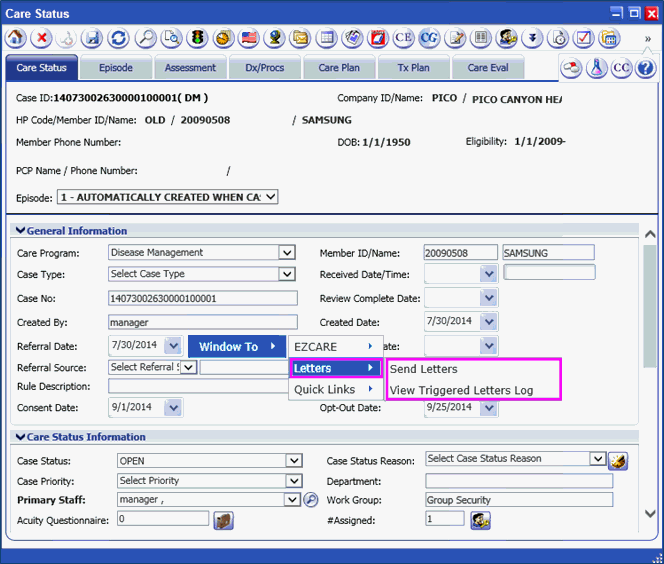
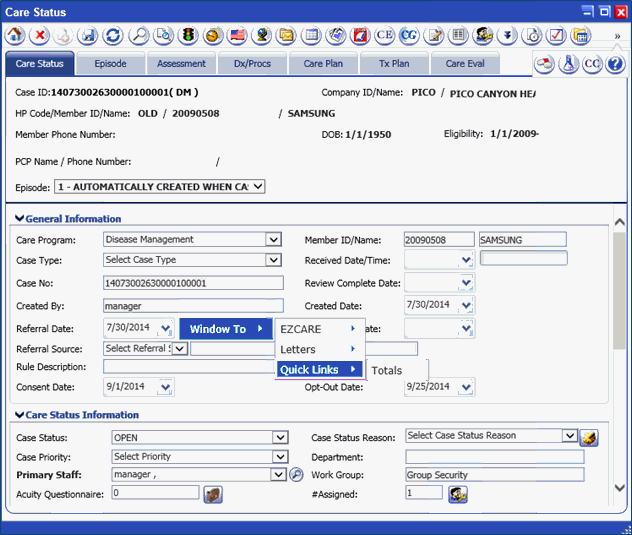
“Window To” option in Care status provides3 sub options. They are:
1. EZCARE: This contains navigation to Case related providers, Member, Health Plan and Staff
2. Letters: This contains send Letters which opens Case Letters screen and View Triggered letters log to view letters that are triggered to this Case.
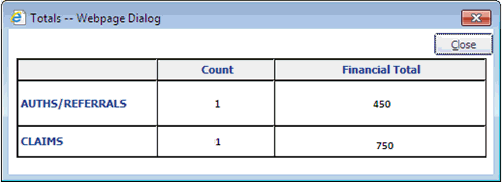
3. Quick Links: This contains “Totals”, which displays the Auth/referral and Claim count and the total amount (which are linked to this Case).